Methods
Identifying Gamete Generation Genes in Bivalve Genomes
I retrieved all RefSeq annotated genomes for bivalve species available on NCBI as of February 2025 (Table 1). To identify genes associated with gametogenesis present in these genomes, I retrieved all sequences under the Gamete Generation (GMT) gene ontology (GO) term (GO:0007276; Figure 1) and used it as this query file in a series of BLAST (vX.XX) alignments, using the bivalve genomes as the databases. Once a list of matching sequences were identified for each genome, I identified associated GO terms and swiss-prot accession numbers (SPID) for each gene using UniProt ID mapping. The source database used in mapping was UniProtKB AC/ID and the target database was UniProtKB. Mapped gene columns were customized to include biological proccess GO information, GO ID, and general GO, excluding cellular component and molecular processes).
Matching sequences for GMT genes for each species were used to abridge genome fastas into fastas only containing GMT sequences. From this, a fasta for each sequence was created where the sequences for any of the 18 taxa were represented (eg., if GeneA was present in all taxa, the corresponding sequence for each taxa would be added to a fasta called GeneA along with a header indicating genome accession and sequence ID within that genome for each sequence).
Table 1. NCBI genome information for 17 RefSeq annotated bivalve genomes and 1 RefSeq annotated outgroup taxa (indicated by *).
| Assembly Accession | Assembly Name | Organism Name | Organism Infraspecific Names Isolate | Organism Infraspecific Names Sex | Annotation Name | Assembly Level | Assembly Release Date | WGS project accession | Assembly Stats Number of Scaffolds |
| GCF_002022765.2 | C_virginica-3.0 | Crassostrea virginica | RU13XGHG1-28 | NCBI Crassostrea virginica Annotation Release 100 | Chromosome | 2017-09-01 | MWPT03 | 10 | |
| GCF_026914265.1 | ASM2691426v1 | Mya arenaria | MELC-2E11 | female | GCF_026914265.1-RS_2023_01 | Chromosome | 2022-12-15 | 17 | |
| GCF_963853765.1 | xbMagGiga1.1 | Magallana gigas | GCF_963853765.1-RS_2024_06 | Chromosome | 2023-12-12 | CAWKXY01 | 29 | ||
| GCF_041381155.1 | Ai_NY | Argopecten irradians | NY | GCF_041381155.1-RS_2024_10 | Chromosome | 2024-08-21 | JAYEEO01 | 1508 | |
| GCF_963676685.1 | xbMytEdul2.2 | Mytilus edulis | GCF_963676685.1-RS_2025_02 | Chromosome | 2024-03-10 | CAVMBL02 | 2368 | ||
| GCF_902652985.1 | xPecMax1.1 | Pecten maximus | NCBI Pecten maximus Annotation Release 100 | Chromosome | 2019-11-26 | CACRWE01 | 3983 | ||
| GCF_025612915.1 | ASM2561291v2 | Magallana angulata | pt1a10 | female | GCF_025612915.1-RS_2022_12 | Chromosome | 2022-10-07 | JANFPH01 | 410 |
| GCF_947568905.1 | xbOstEdul1.1 | Ostrea edulis | GCF_947568905.1-RS_2023_05 | Chromosome | 2022-12-16 | CANOQP01 | 52 | ||
| GCF_021730395.1 | MADL_Memer_1 | Mercenaria mercenaria | GCF_021730395.1-RS_2023_01 | Chromosome | 2022-02-01 | JAIXLV01 | 4975 | ||
| GCF_020536995.1 | UMN_Dpol_1.0 | Dreissena polymorpha | Duluth1 | male | NCBI Dreissena polymorpha Annotation Release 100 | Chromosome | 2021-10-21 | JAIWYP01 | 193 |
| GCF_036588685.1 | PNRI_Mtr1.1.1.hap1 | Mytilus trossulus | FHL-02 | GCF_036588685.1-RS_2024_02 | Chromosome | 2024-02-13 | JAZBVT01 | 540 | |
| GCF_026571515.1 | ASM2657151v2 | Ruditapes philippinarum | M1 | male | GCF_026571515.1-RS_2023_10 | Contig | 2022-12-01 | JAKTTH01 | 15873 |
| GCF_002113885.1 | ASM211388v2 | Mizuhopecten yessoensis | male | NCBI Mizuhopecten yessoensis Annotation Release 100 | Scaffold | 2017-06-12 | NEDP02 | 82658 | |
| GCF_021869535.1 | xbMytCali1.0.p | Mytilus californianus | M0D057914Y | NCBI Mytilus californianus Annotation Release 100 | Scaffold | 2022-02-02 | JAKFGE01 | 175 | |
| GCF_033153115.1 | CSIRO_AGI_Sech_v1 | Saccostrea echinata | AGI-Se365-2 | GCF_033153115.1-RS_2023_12 | Contig | 2023-10-31 | JAVQLB01 | 424 | |
| GCF_032062105.1 | CSIRO_AGI_Scuc_v1 | Saccostrea cuccullata | Sc308-1 | GCF_032062105.1-RS_2024_01 | Contig | 2023-09-27 | JAVVLV01 | 23868 | |
| GCF_031769215.1 | AGI_CSIRO_Ybal_v1 | Ylistrum balloti | Yb309-2 | GCF_031769215.1-RS_2023_10 | Contig | 2023-09-20 | JAUZWB01 | 1371 | |
| GCF_000327385.1* | Helro1 | Lottia gigantea | Annotation submitted by NCBI RefSeq | Scaffold | 2012-12-20 | AMQO01 | 4469 |
Generating Species and Gene Tree to Map Gene Evolution
I created a consensus tree using ultraconserved elements (UCEs) present within my selected bivalves.
To identify and harvest I used two sets of 10,000 bait sequences, designed for molluscan (v1) and bivalves (v2) by Yi-Xuan et al. (2024) using Phyluce (v1.7.3). Bivalve and outgroup genomes were aligned to each bait file using `phyluce_probe_run_multiple_lastzs_sqlite` with a cutoff of 80% identity for sequences to be kept. Aligned sequences were extracted as FASTA using `phyluce_proble_slice_sequence_from_genomes` with a 500 bp flanking sequence included with matched bait loci to retain additional sequence information (and therefore potential variation) outside of the UCE core itself. Extracted sequences were then matched to bait sequences for downstream analysis using phyluce_assembly_match_contigs_to_probes`.
Two data sets were created for each bait version: a complete set which contains only the UCEs present in all taxa, and an incomplete set which contains the UCEs present in any of the taxa, using `phyluce_assembly_get_match_counts`, resulting in a total of four data sets (complete v1, complete v2, incomplete v1, incomplete v2). FASTA sequences were extracted from these datasets using `phyluce_assembly_get_fastas_from_match_counts`, aligned, and trimmed.
Alignment and edge trimming was done using `phyluce_align_seqcap_align` with arguments for 18 taxa (17 bivalves + 1 outgroup) and MAFFT muti-sequence alignment. [megan note: edge trimmed outputs were not used for downstream analyses, but were done as part of the phyluce tutorial for learning. internal trimming was done next and the outputs from those were used for downstream analyses].
Alignment was done using `phyluce_align_seqcap_align` for 18 taxa using MAFFT multi-sequence alignment, `–incomplete-matrix argument`, and `–no-trim` (to skip edge trimming). For internal trimming, `phyluce_align_get_gblocks_trimmed_alignments_from_untrimmed` was used to trim the aligned FASTAs. Aligned and trimmed sequences were cleaned using `phyluce_align_remove_locus_name_from_files` to remove taxon and locus names.
Aligned, cleaned, and trimmed sequences could then be used to generate data matrices with varying degrees of coverage. Matrices were created for the incomplete datasets (both v1 and v2) with specified 50%, 75%, or 95% coverage of the 17 taxa using `phyluce_align_get_only_loci_with_min_taxa`. Matrices were concatenated and converted to phylip data type to be used in IQtree using `phyluce_align_concatenate_alignments` with `–phylip` argument specified.
IQtree (v3.0.1) was used to generate consensus trees using the 50% and 75% coverage taxa. Tree model was determined using ModelFinder Plus (MFP) argument within IQtree. Best-fit model as determined by MFP was passed to IQtree to generate a tree using 10000 bootstraps and 10000 ALRT iterations with -bnni specified to optimize bootstraps via nearest neighbor interchange, with outgroup specified as GCF_000327385.1 (owl limpet). This process was repeated with each individual gene fasta file as well to create gene trees for downstream tree distance comparisons. Consensus trees were visualized using FigTree (v1.4.4) and ggtree (vX.XX).
Quantifying Evolutionary Divergence and Trends
To quantify evolutionary differences in taxa relationships represented between the consensus tree and individual genes, treedist() from the R package Phangorn (vX.X) was used. Gene trees and the chosen consensus tree were pruned, as needed, to ensure same species coverage for each comparison. Branch score difference, which takes into account tree topology and branch length, was the primary distance metric analyzed.
To identify genes that show significant evolutionary divergence from the species relationships as a whole, outliers were identified for all gene trees with full taxa coverage (ie., all 18 taxa present) if they had a Z score of <-3 or >3. Genes with <18 taxa coverage had a heatmap generated for absence (value 0) presence (value 1) with genes clustered by similar species coverage patterns, and species grouped by taxonomic groups to visualize relationships between gene presence and taxon groups.
Next steps in analysis: Add hermaphoriditism vs gonochorism and pelagic eggs vs demersal eggs to my absense/presense matrix and run “evo-scope” a correlative evolution analyses to determine correlation between life history traits and genes, independent of phylogenetic relationships, to start making sense of the genes with less than 18 taxa present.
Results
Across consensus trees (50 and 75 v1 and v2 trees) there unresolved relationships in the mussel and clam clade (Figure 2). The 50% coverage tree using v1 baits was chosen as clade relationships were in better agreement with trees created in previous studies (Yi et al.; Chen et al.).
In total, there were 3235 genes found in my bivalves associated with GMT. Of these, 2758 genes (85%) were present in all 18 taxa and 27 genes present in only one taxa (Figure 3). Branch score distance was highest in full coverage trees, as expected (Figure 4). Preliminary patterns are emerging in gene coverage for the non full pattern trees and require further analyses (Figure 5).
Table 2. Species with RefSeq annotated genomes, genome size and number of sequences in genome, number of sequences in the query (from gamete generation GO), and number of query matches to the database.
| Assembly Accession | Organism Name | Common Name | Genome Size (Gbp) | # Seq in DB (genome) | # Seq in Querey | # of Query Matches |
| GCF_000327385.1* | Lottia gigantea | Owl Limpet | 0.027 | 23831 | 4234 | 3068 |
| GCF_002022765.2 | Crassostrea virginica | Eastern Oyster | 0.118 | 60213 | 4234 | 3129 |
| GCF_002113885.1 | Mizuhopecten yessoensis | Yesso Scallop | 0.082 | 41567 | 4234 | 3122 |
| GCF_020536995.1 | Dreissena polymorpha | Zebra Mussel | 0.140 | 75288 | 4234 | 3105 |
| GCF_021730395.1 | Mercenaria mercenaria | Hard Clam | 0.121 | 63247 | 4234 | 3058 |
| GCF_021869535.1 | Mytilus californianus | California Mussel | 0.104 | 49739 | 4234 | 3083 |
| GCF_025612915.1 | Magallana angulata | Portugese Oyster | 0.102 | 49950 | 4234 | 3135 |
| GCF_026571515.1 | Ruditapes philippinarum | Manila Clam | 0.097 | 57637 | 4234 | 3098 |
| GCF_026914265.1 | Mya arenaria | Soft Shell Clam | 0.126 | 61919 | 4234 | 3116 |
| GCF_031769215.1 | Ylistrum balloti | Ballot Saucer Scallop | 0.042 | 24047 | 4234 | 3106 |
| GCF_032062105.1 | Saccostrea cuccullata | Natal Rock Oyster | 0.091 | 56432 | 4234 | 3120 |
| GCF_033153115.1 | Saccostrea echinata | Blacklip Rock Oyster | 0.065 | 36217 | 4234 | 3143 |
| GCF_036588685.1 | Mytilus trossulus | Pacific Blue Mussel | 0.099 | 53269 | 4234 | 3128 |
| GCF_041381155.1 | Argopecten irradians | Bay Scallop | 0.085 | 41903 | 4234 | 3129 |
| GCF_902652985.1 | Pecten maximus | Great Scallop | 0.072 | 39918 | 4234 | 3116 |
| GCF_947568905.1 | Ostrea edulis | European Flat Oyster | 0.117 | 57349 | 4234 | 3140 |
| GCF_963676685.1 | Mytilus edulis | Blue Mussel | 0.134 | 62345 | 4234 | 3128 |
| GCF_963853765.1 | Magallana gigas | Pacific Oyster | 0.110 | 51045 | 4234 | 3127 |

Fig 2a. 50% coverage (v1 baits)

Fig 2b. 50% coverage (v2 baits)

Fig 2c. 75% coverage (v1 baits)

Fig 2d. 75% coverage (v2 baits).
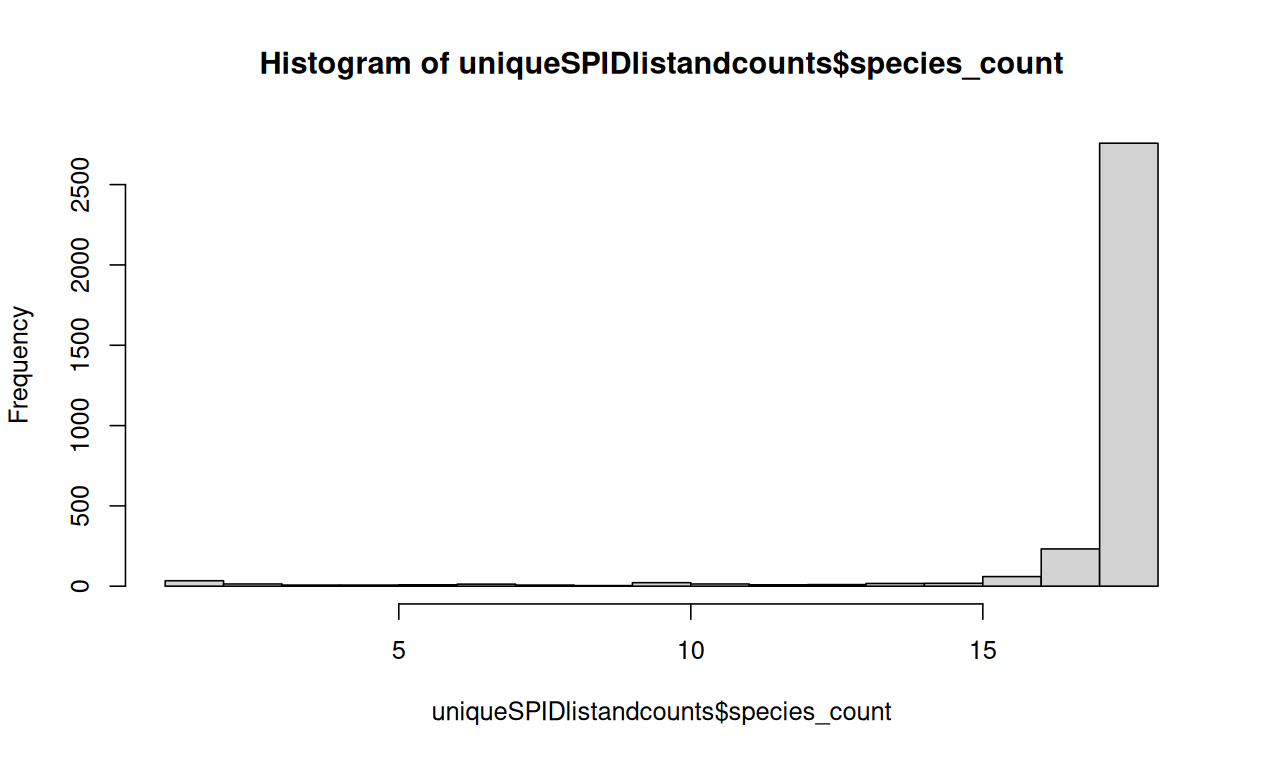
Figure 3. Histogram showing taxa coverage (y axis) for various genes (y axis).
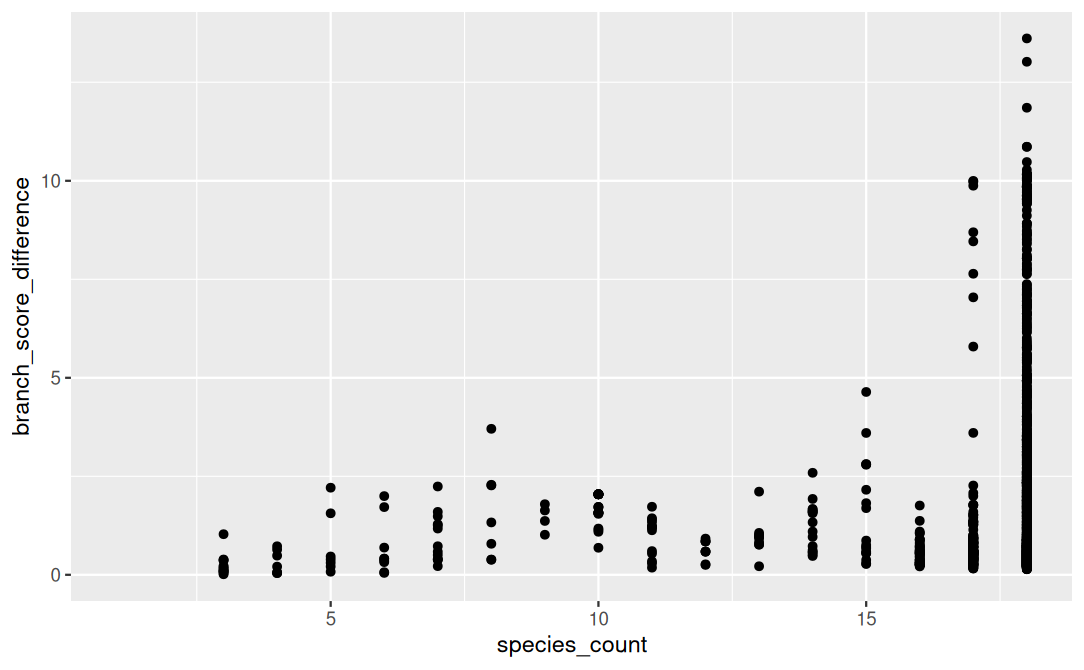
Figure 4. Branch score distance of gene trees vs species trees, grouped my taxa coverage.

Figure 5. Gene presence and absence by taxon group